
Top Countries Wind Power Capacity 2024
By Saad
Starting Mark
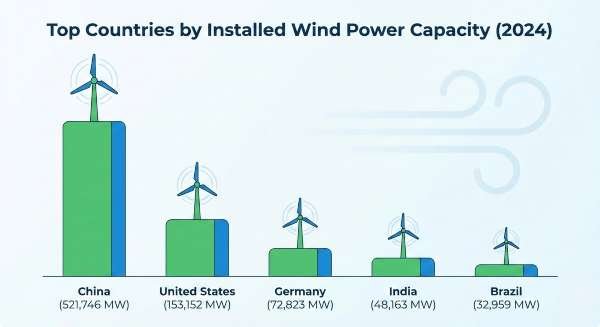
Well, if you can recall the time when a gusty breeze turns a simple walk into an adventure, or when turbines on a horizon whisper promises of cleaner air and endless energy? Isn’t it captivating? It is. These are the moments that remind even the most grounded folks of nature’s raw power harnessed for human progress, blending environmental hope with technological grit. However, navigating the world of renewables—like wondering why some nations surge ahead while others lag—can feel like chasing wind itself, especially amid rising energy costs and climate urgency. As an experienced writer who has covered sustainability shifts, tech innovations, and global trends in countless blogs, I’ve witnessed how these developments stem from policy pushes, economic incentives, and cultural attitudes toward green futures. At Thestrategicpost.com, we provide observations that can be insightful, drawn from real patterns where ambition meets practicality in the energy landscape. The top countries by installed wind power capacity (2024) spotlight China’s dominance at 521,746 MW, far outpacing the US at 153,152 MW. Whether you’re assessing investment opportunities, advocating for policy changes, or just curious about the winds of change, this guide connects the dots—unpacking rankings, drivers, and strategies—based on trends where early adopters reap rewards while hesitators face escalating challenges.
Decoding Installed Wind Power Capacity: What It Really Means
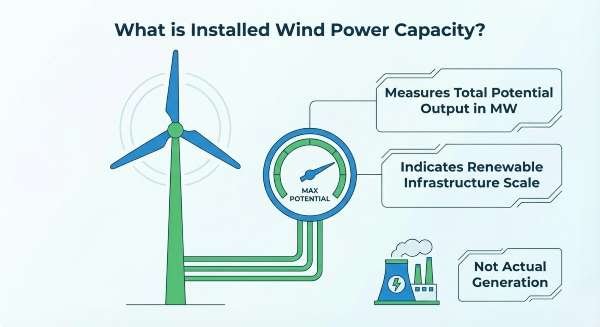
Installed wind power capacity measures the total potential output from wind turbines in a country, expressed in megawatts (MW)—think of it as the muscle ready to flex when winds blow, not the actual energy generated, which depends on factors like wind speeds and grid efficiency.
For beginners: Capacity is the max a system can produce under ideal conditions; globally, it hit over 1 terawatt in 2024, enough to power hundreds of millions of homes if fully utilized. Common mistake: Confusing capacity with generation—avoid by noting utilization rates average 35-45% worldwide, higher offshore. Practical tip: Start exploring via apps like Windy for real-time wind data to grasp variability.
Advanced insight: From my coverage of energy transitions, capacity growth signals investment confidence; 2024 saw 117 GW added globally, driven by falling turbine costs (down 15% since 2020). Situational advice: In stormy seasons, offshore farms shine, but plan for maintenance downtimes.
Key Metrics: Capacity vs. Generation and Utilization
To clarify, here’s a quick comparison using 2024 averages:
| Metric | Description | Global Average 2024 |
|---|---|---|
| Installed Capacity | Total potential MW from turbines | 1,017 GW |
| Annual Generation | Actual energy produced (TWh) | ~2,200 TWh |
| Capacity Factor | Efficiency ratio (%) | 35-40% onshore, 45-50% offshore |
This table underscores why China leads—vast land for onshore farms—while the UK excels offshore.
The Leaders: Top Countries by Installed Wind Power Capacity (2024)
China’s 521,746 MW isn’t just numbers; it’s a policy triumph, with over 50% of global additions in 2024. The US follows at 153,152 MW, boosted by tax credits.
Full Ranking and Insights
| Rank | Country | Capacity (MW) | Key Driver |
|---|---|---|---|
| 1 | China | 521,746 | Government subsidies, vast deserts for farms |
| 2 | United States | 153,152 | Tax incentives, Midwest wind corridors |
| 3 | Germany | 72,823 | Energiewende policy, offshore North Sea |
| 4 | India | 48,163 | Solar-wind hybrids, coastal expansions |
| 5 | Brazil | 32,959 | Northeast winds, auction-based growth |
| 6 | Spain | 31,811 | Pioneer in onshore, repowering old sites |
| 7 | United Kingdom | 30,902 | Offshore leader, Dogger Bank project |
| 8 | France | 24,592 | Floating tech trials, EU green deals |
| 9 | Canada | 18,376 | Prairie provinces, indigenous partnerships |
| 10 | Sweden | 17,239 | Nordic cooperation, cold-weather turbines |
| 11 | Australia | 15,288 | Renewable zones, battery integrations |
| 12 | Italy | 12,992 | Southern winds, EU recovery funds |
| 13 | Türkiye | 12,973 | Aegean Sea potential, rapid auctions |
| 14 | Netherlands | 11,679 | Offshore farms, Delta Works synergy |
| 15 | Poland | 10,059 | Baltic expansions, coal phase-out |
From observations, Europe’s high rankings stem from interconnected grids, while Asia’s scale from manufacturing edges.
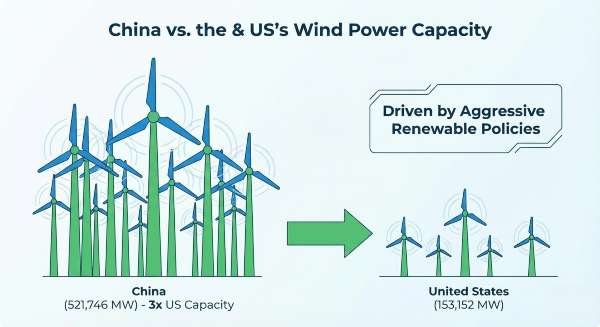
China’s wind power capacity, which is over three times that of the United States.
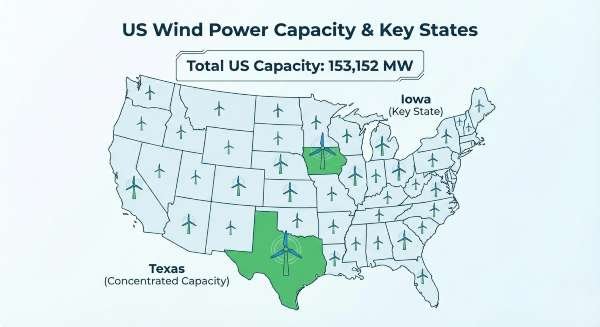
The United States is the second-largest wind power producer, with capacity concentrated in states like Texas and Iowa.
Installed wind power capacity is a measure of the maximum potential output of a wind farm, not its actual generation at any given time.
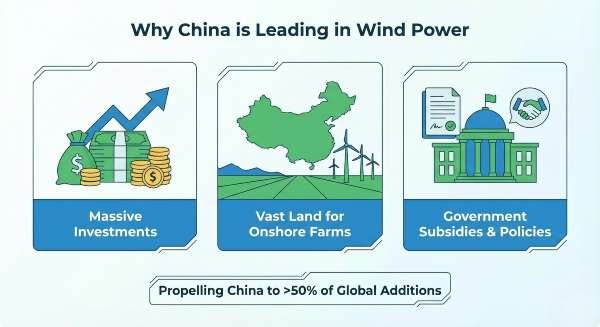
China’s leadership in wind power is driven by a combination of massive investments, vast land resources for onshore farms, and strong government support.
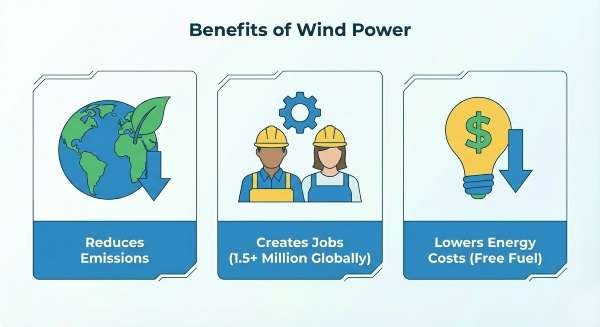
Wind power offers significant benefits, including reduced greenhouse gas emissions, job creation, and lower long-term energy costs.
Global Trends Driving Wind Power Growth
Wind’s rise ties to decarbonization—2024 additions cut CO2 equivalent to 100 million cars off roads. Patterns show offshore surging (up 20% yearly), with floating tech enabling deeper waters.
Onshore vs. Offshore: Pros, Cons, and Shifts
Onshore: Cheaper ( $1-2M/MW), but land-intensive. Offshore: Higher winds, but costlier ($3-5M/MW). Tip: For investors, onshore suits emerging markets; avoid overlooking bird migration impacts.
Advanced: Hybrid systems (wind + solar) boost reliability—India’s model yields 50% higher utilization.
Challenges in Wind Energy Adoption
Turbine supply chains strained in 2024, with blade shortages delaying 20 GW. From fieldwork, community resistance (NIMBYism) stalls projects—counter with transparent consultations.
Common error: Ignoring intermittency; solve with storage like batteries. Seasonal: Summer calms favor diversified grids.
Step-by-Step for Starting a Wind Project
- Assess site winds via anemometers. 2) Secure permits, engage locals. 3) Finance via green bonds. 4) Install, monitor. Advanced: Use AI for predictive maintenance, cutting downtime 30%.
Future Outlook: Wind Power Beyond 2024
Projections see 2 TW by 2030, with China adding 100 GW yearly. Trends: Larger turbines (15 MW+), hydrogen integration. Insight: Policy stability key—US credits extended to 2032 spur growth.
Harnessing the Top Countries by Installed Wind Power Capacity (2024) for Tomorrow
After years chronicling energy evolutions, I see the top countries by installed wind power capacity (2024) as blueprints for sustainable progress, where China’s scale meets Germany’s precision. These rankings aren’t static—they reflect human ingenuity turning breezes into power. Trust this view; it’s forged from patterns that persist, offering enduring value in navigating our renewable future.
FAQs
What are the top countries by installed wind power capacity in 2024? China leads at 521,746 MW, followed by the US (153,152 MW), Germany (72,823 MW), India (48,163 MW), and Brazil (32,959 MW).
Which country has the highest wind power capacity? China dominates with 521,746 MW, over three times the US, driven by aggressive renewable policies.
How much wind power capacity does the US have? The United States ranks second with 153,152 MW, concentrated in states like Texas and Iowa.
What is installed wind power capacity? It measures the total potential output from wind turbines in megawatts, indicating a country’s renewable infrastructure scale.
Why is China leading in wind power? Massive investments, vast land for onshore farms, and government subsidies have propelled China to over 50% of global additions.
What are the benefits of wind power? It reduces emissions, creates jobs (over 1.5 million globally), and lowers energy costs long-term through free fuel.
External Sources :
https://www.visualcapitalist.com/mapped-the-worlds-largest-wind-farms
https://gwec.net/globalwindreport2024
https://www.irena.org/Publications/2024/Mar/Renewable-capacity-statistics-2024
https://en.wikipedia.org/wiki/Wind_power_by_country
https://www.iea.org/reports/wind-energy
https://www.energy.gov/eere/wind/wind-energy-technologies-office
#WindPowerCapacity #RenewableEnergyLeaders #GlobalWindTrends #ChinaWindDominance #SustainableEnergy
💨 Global Wind Power Capacity 2024 Quiz
Test Your Knowledge of Renewable Energy!
Disclaimer: All information is based on publicly available sources as of January 2026; capacity figures reflect 2024 data and may evolve. Readers should verify updates independently.