
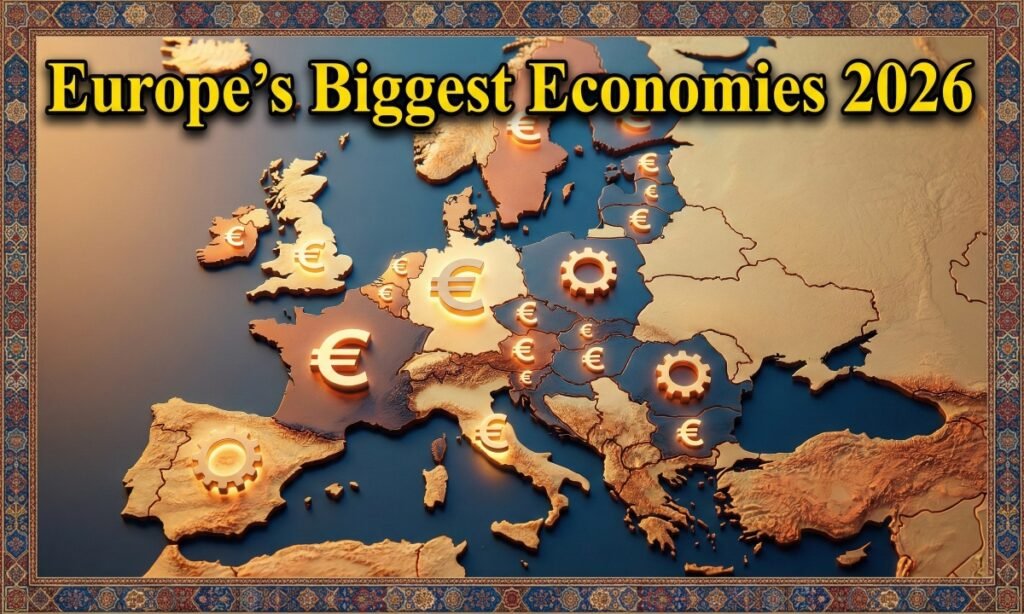
Europe’s Biggest Economies in 2026
Here in my Karachi living room, as the early February sun slants through the jharoka window—casting patterns on the faded Persian rug that once belonged to my aunt—I pause mid-sip of my doodh patti, scrolling through morning headlines on my tablet. It’s one of those quiet rituals, the steam curling up like forgotten memories, when a message pings from my colleague in Lahore: “With all this talk of Europe’s green tech boom,” he types, “is it time to diversify our portfolio there?” His words linger, blending with the distant hum of the city waking, and it strikes me how, in 2026, as reports highlight a 1.2% average growth across the continent (fueled by renewable investments surging 15% year-over-year), these economic rankings aren’t just numbers. They’re invitations to reflect on resilience, the kind that ties our personal net worth to broader cultural currents, where stability meets innovation in ways that redefine success—not as endless accumulation, but as harmonious progress.
I’ve mulled over such shifts in conversations like these, where data meets the human touch. Europe’s economies in 2026, per IMF projections, reveal a tapestry of powerhouses and risers, blending old-world heritage with modern pivots. Let’s explore them gently, like savoring a shared meal, weaving in why they matter for identity, time, and that subtle value we chase in our daily rhythms.
The Top 30: A Snapshot of Continental Strength
The IMF’s 2025 projections for 2026 paint a vivid picture: Nominal GDPs in billions of USD, showcasing Germany’s lead at $5,328B, down to Slovenia’s $86B. It’s a list that honors tradition while nodding to transformation.
Here’s the rundown:
- Germany → $5,328B
- United Kingdom → $4,226B
- France → $3,559B
- Italy → $2,702B
- Russia → $2,509B
- Spain → $2,042B
- Netherlands → $1,413B
- Poland → $1,110B
- Switzerland → $1,075B
- Belgium → $761B
- Ireland → $750B
- Sweden → $712B
- Austria → $604B
- Norway → $548B
- Denmark → $500B
- Romania → $445B
- Czechia → $417B
- Portugal → $365B
- Finland → $336B
- Greece → $305B
- Hungary → $270B
- Ukraine → $224B
- Slovakia → $168B
- Bulgaria → $142B
- Croatia → $113B
- Serbia → $112B
- Luxembourg → $108B
- Lithuania → $105B
- Belarus → $91B
- Slovenia → $86B
These figures, drawn from careful forecasts, reflect recoveries from recent global hiccups—pandemics, energy crises, geopolitical tensions. Germany holds firm, its engineering legacy a quiet anchor. Yet, look at Poland’s climb: A nod to Eastern Europe’s hustle, where post-Soviet grit meets EU integration.
Germany’s Dominance: Engineering a Legacy
Atop the list, Germany’s $5.328 trillion economy feels like a well-aged wine—robust, layered. I remember a trip to Berlin years ago, wandering through a Christmas market with glühwein in hand, the scent of bratwurst mingling with conversations on work-life balance. That efficiency, from auto giants like Volkswagen to renewables, underpins it all.
In 2026, exports drive much of this: Machinery, chemicals, vehicles. But it’s the cultural ethos—precision without pretense—that ties to net worth. Here, success is measured in sustainable growth, where high wages (average $63,600 per capita) afford time for family hikes or gallery visits. (A gentle contrast to Karachi’s entrepreneurial sprint, yet both value craftsmanship.)
The UK’s Resilient Island Economy
Second at $4.226 trillion, the UK blends finance with creativity. Post-Brexit adjustments? They’ve steadied, with London’s fintech scene buzzing. Think of foggy mornings in a Camden cafe, where startups pitch over flat whites— that’s the vibe fueling services, which make up 80% of GDP.
For identity, it’s fascinating: A nation of shopkeepers evolving into innovators, where cultural exports like music and film add intangible value. In our net-worth chats, this reminds us success often hides in adaptability, turning challenges into chapters.
Western vs. Eastern Europe: Contrasts in Growth
Europe’s economic map splits intriguingly—Western stalwarts like France and Italy versus Eastern dynamos like Poland and Romania. The former boast mature markets; the latter, rapid catches-up.
To illuminate, I’ve assembled a custom table comparing key clusters: Nominal GDP, growth projections, and per capita insights (blended from IMF data). It’s like comparing family recipes—each unique, yet sharing roots.
| Region/Group | Key Economies | Total GDP ($$ B) | Avg. Projected Growth 2026 | Avg. GDP per Capita ( $$) | Cultural Reflection |
|---|---|---|---|---|---|
| Western Europe (Top Heavyweights) | Germany, France, Italy, UK | 15,815 | 0.9% | 50,000+ | Heritage-driven stability; think French bistros symbolizing leisurely success, where value includes savoring time. |
| Northern Europe (Nordic & Benelux) | Netherlands, Sweden, Belgium, Denmark, Norway | 3,934 | 1.2% | 60,000+ | Equality-focused; Scandinavian hygge—cozy evenings with books—mirrors balanced net worth, prioritizing well-being over wealth. |
| Eastern Europe (EU Risers) | Poland, Romania, Czechia, Hungary | 2,242 | 3.5% | 20,000-30,000 | Resilience-forged; post-communist markets like Warsaw’s vibrant streets evoke entrepreneurial spirit, turning history into hustle. |
| Southern Europe (Mediterranean Mix) | Spain, Portugal, Greece, Italy (partial) | 5,414 | 1.8% | 35,000 | Sun-soaked innovation; Greek tavernas gathering friends highlight community as true currency, blending tourism with tech. |
| Non-EU Eastern (Geopolitical Players) | Russia, Ukraine, Belarus, Serbia | 4,936 | 1.0% | 10,000-15,000 | Resource-reliant; Ukrainian borscht shared amid challenges speaks to enduring identity, where success defies odds. |
| Small Powerhouses (Specialized) | Switzerland, Ireland, Luxembourg | 1,933 | 1.5% | 80,000+ | Niche excellence; Swiss chocolate rituals remind us precision crafts high value, often in quiet alpine settings. |
This structure reveals dynamics: Western Europe’s heft (over 50% of total) contrasts Eastern’s velocity. For culture, it’s a mirror—Western traditions emphasize refinement, Eastern ones reinvention. In net-worth terms, it prompts curiosity: Where does your portfolio align with these rhythms?
France and Italy: Elegance Meets Endurance
France’s $3.559 trillion slots third, a blend of luxury (think Chanel) and aerospace. I recall a Paris evening, crepes in hand, watching the Seine— that joie de vivre infuses an economy where tourism and agriculture add flavor.
Italy, fourth at $2.702 trillion, thrives on design and manufacturing. From Milan’s fashion weeks to Tuscan vineyards, it’s a reminder: Success often roots in artisanal pride, where family businesses build legacies beyond ledgers.
Emerging Stories: Poland’s Leap and Beyond
Eighth-placed Poland at $1.110 trillion exemplifies ascent—tech hubs in Krakow drawing global talent. It’s like watching a folk dance evolve into modern choreography, blending heritage with high-speed rail.
Further down, Romania ($445B) and Czechia ($417B) shine in IT and autos. These narratives tie to identity: Nations reclaiming narratives, where economic growth fosters cultural confidence. For us in South Asia, it’s akin to our own startup surges—small sparks igniting broader value.
A Predictive Insight: The 2028 Eastern Tilt
Pondering ahead, here’s a unique musing: By 2028, as AI integration accelerates (with EU investments hitting €20B annually), Eastern Europe—led by Poland—could surpass Italy in nominal GDP, driven by lower costs and talent pools. Why? Geopolitical realignments favor nearshoring, pulling supply chains east. It matters because it democratizes prosperity, shifting success from inherited wealth to innovative grit, enriching continental identity while offering diversified net-worth plays. (A subtle pivot, echoing how traditions adapt without losing essence.)
Cultural Threads: How Economies Shape Lives
These rankings open doors to deeper reflections. In Norway ($548B), oil funds enable generous paternity leaves—time for fjord walks with kids, valuing bonds over bonuses. Contrast with Greece ($305B), where olive harvests tie to communal meals, reminding us money serves meaning.
Gentle humor: If Karachi had a spot, it’d rank for sheer vibrancy—chaotic bazaars teaching negotiation as art. But seriously, Europe’s mix inspires: Success as symphony, where data harmonizes with daily joys.
Music plays in: Sweden’s ABBA royalties subtly boost its $712B, a nod to cultural exports funding futures. In homes, it’s records spinning on lazy Sundays, blending nostalgia with net worth.
Actionable Takeaways: Notes Over Noon Chai
If we were chatting on a rooftop, wind carrying jasmine scents, I’d share these whispers:
Diversify Thoughtfully: Eye Poland or Romania for growth plays—start with ETFs tracking Eastern EU indices. It’s like planting mango seeds; patience yields fruit.
Align with Values: If hygge calls, consider Nordic bonds. Match investments to your cultural leanings—French wines for elegance, Swiss banks for security.
Monitor Geopolitics: Russia’s $2.509B ties to energy; watch sanctions. Hedge with renewables, mirroring life’s need for backups.
Build Personal Resilience: Emulate Europe’s balance—set aside time for rituals, like family dinners. True value compounds quietly.
Not blueprints, just breadcrumbs for your journey.
Wrapping Reflections: Economies as Echoes of Us
In 2026’s landscape, Europe’s biggest economies—from Germany’s steadfast lead to Slovenia’s steady close—mirror our own pursuits: Blending data with dreams, memory with momentum. As Karachi’s afternoon azan calls, I’m reminded: Net worth isn’t solitary; it’s woven into cultural fabrics, where success honors time, identity, and subtle joys.
These projections invite affectionate curiosity—what stories do your investments tell?
FAQ’s
What is the largest economy in Europe in 2026? Germany leads with a projected GDP of $5,328 billion, driven by manufacturing and exports.
How does the UK’s economy rank in Europe for 2026? The United Kingdom ranks second with $4,226 billion, bolstered by services and fintech innovations.
What are the top five European economies by GDP in 2026? Germany ($5,328B), United Kingdom ($4,226B), France ($3,559B), Italy ($2,702B), and Russia ($2,509B).
Why is Poland rising in Europe’s economic rankings? Poland’s $1,110 billion GDP reflects strong growth in tech and manufacturing, aided by EU integration and investments.
How do Eastern European economies compare to Western ones in 2026? Eastern economies like Poland show higher growth rates (around 3.5%), while Western ones like Germany average 0.9%, highlighting contrasts in maturity and momentum.
What factors influence Europe’s economic projections for 2026? Key drivers include renewable energy shifts, geopolitical stability, and tech investments, with variations by region.
Will any changes occur in Europe’s top economies by 2028? Projections suggest Eastern risers like Poland may overtake some Western peers, due to AI and nearshoring trends.
If these insights evoked your own economic wanderings—like that one investment that felt like home—share in the comments: What’s your take on Europe’s shifts? Forward to a friend mulling moves, and subscribe or join our WhatsApp channel for more on culture, net worth, and life’s strategic pauses.
Authoritative References:
- IMF World Economic Outlook Database – Source for GDP projections and economic analyses.
- World Bank Europe and Central Asia Overview – Insights on regional growth and development.
- European Commission Economic Forecast – EU-specific economic projections and trends.
- OECD Economic Outlook for Europe – Comparative data on growth and policy.
- Statista Europe GDP Statistics – Aggregated GDP rankings and forecasts.
- Visual Capitalist Top Economies – Visual breakdowns of global and European GDPs.
#EuropeEconomies2026, #IMFGDP, #TopGDPs, #GermanyEconomy, #PolandGrowth, #NetWorthCulture, #EconomicTrends