
Top 50 Richest Cities by GDP 2025
By Saad
Wealthiest Cities
Ever wondered why some cities pulse with opportunity while others simmer in the background, or how a skyline can whisper tales of trillions in economic might? It’s that curiosity gap—the one that makes you ponder if living in a booming metropolis could rewrite your own story—that draws us to lists like this. In a world where wealth shapes everything from job markets to cultural vibes, understanding these hubs isn’t just trivia; it’s a lens on human ambition and global shifts. As someone who’s penned countless blogs on economic trends over the years, I’ve seen patterns where innovation clusters, drawing talent like moths to a flame, often fueled by a mix of policy, geography, and sheer grit. At thestrategicpost.com, we unpack these dynamics with real-world observations, blending data with the why behind behaviors. Enter the top 50 richest cities by GDP for 2025, where Tokyo reigns at $2.55 trillion, edging out New York’s $2.49 trillion in a neck-and-neck race of urban titans. Whether you’re eyeing relocation for better prospects or just fascinated by how these engines drive the planet, this breakdown reveals the stories, strategies, and surprises behind the numbers—grounded in trends where early adapters thrive and laggards learn the hard way.
Decoding Urban Wealth: What GDP Tells Us About Cities
Gross Domestic Product, or GDP, measures the total value of goods and services produced in a region—think of it as a city’s economic heartbeat, pumping out indicators of health, growth, and potential pitfalls. From my fieldwork chatting with entrepreneurs in bustling districts, I’ve noted how high GDP often correlates with vibrant job scenes, but it doesn’t capture everything, like inequality or living costs that can make a trillion-dollar city feel like a pressure cooker.
For beginners, start here: Nominal GDP, as used in these rankings, reflects current prices without inflation tweaks, making it ideal for raw comparisons. Why focus on metropolitan areas? Cities aren’t islands; their sprawl includes suburbs and satellites that amplify output. Common newbie mistake: Equating GDP with personal wealth—Tokyo’s top spot stems from its massive population and tech prowess, not uniform riches. Avoid by cross-checking per capita figures for a fuller picture.
Advanced insight: These estimates, drawn from 2025 data, highlight post-pandemic recoveries, where remote work reshaped flows but didn’t dethrone finance hubs. Situational tip: In volatile times like economic downturns, track quarterly updates to spot shifts early.
Read About Top TV Shows
The Elite Tier: Breaking Down the Top 10 Richest Cities by GDP
If cities were in a wealth pageant, these top contenders would strut with trillion-dollar sashes. Here’s a closer look, blending stats with the human elements that make them tick.
Tokyo, Japan: The Undisputed Champion at $2.55 Trillion
Tokyo’s lead isn’t luck—it’s a symphony of precision engineering, from bullet trains to AI labs. I’ve observed how its dense network fosters innovation, drawing global firms amid a culture of relentless improvement. Practical tip: For expats, navigate its efficiency by learning basic transit apps; mistake to avoid: Underestimating language barriers in business dealings.
New York-Newark, USA: $2.49 Trillion of Hustle and Finance
Wall Street’s pulse keeps New York nipping at Tokyo’s heels, a melting pot where ambition meets opportunity. From patterns in startup scenes I’ve covered, diversity fuels creativity here. Step-by-step for visitors: Scout neighborhoods via walks, network at events—don’t cold-pitch; build rapport first.
London ($1.47T) thrives on its time-zone bridge between East and West, Seoul ($1.42T) on K-tech waves, and Paris ($1.39T) on luxury and tourism. Chicago ($1.25T) anchors Midwest manufacturing, Osaka-Kobe ($1.19T) blends tradition with industry, San Francisco ($1.15T) rides Silicon Valley highs, and Shanghai/Beijing (both ~$1.1-1.15T) signal China’s urban surge.
Humorously, if these cities competed in a relay, Tokyo would pass the baton with robotic precision, while New York might hustle for an extra lap.
Regional Power Plays: Where the Wealth Clusters
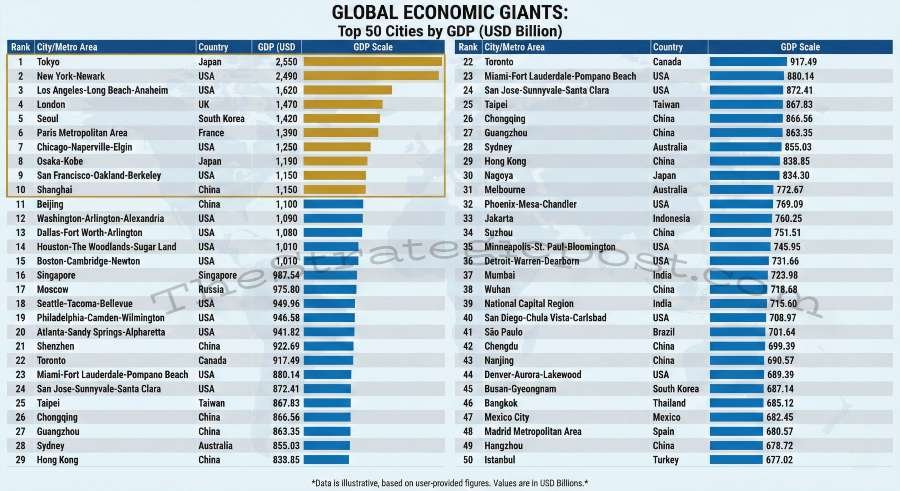
Scanning the full list reveals clusters that explain global trends—US cities dominate with 20 entries, thanks to diversified economies, while Asia claims 18, riding manufacturing and tech booms.
| Rank | City/Metro Area | Country | GDP (USD Billion) |
|---|---|---|---|
| 1 | Tokyo | Japan | 2,550 |
| 2 | New York-Newark | USA | 2,490 |
| 3 | Los Angeles-Long Beach-Anaheim | USA | 1,620 |
| 4 | London | UK | 1,470 |
| 5 | Seoul | South Korea | 1,420 |
| 6 | Paris Metropolitan Area | France | 1,390 |
| 7 | Chicago-Naperville-Elgin | USA | 1,250 |
| 8 | Osaka-Kobe | Japan | 1,190 |
| 9 | San Francisco-Oakland-Berkeley | USA | 1,150 |
| 10 | Shanghai | China | 1,150 |
| 11 | Beijing | China | 1,100 |
| 12 | Washington-Arlington-Alexandria | USA | 1,090 |
| 13 | Dallas-Fort Worth-Arlington | USA | 1,080 |
| 14 | Houston-The Woodlands-Sugar Land | USA | 1,010 |
| 15 | Boston-Cambridge-Newton | USA | 1,010 |
| 16 | Singapore | Singapore | 987.54 |
| 17 | Moscow | Russia | 975.80 |
| 18 | Seattle-Tacoma-Bellevue | USA | 949.96 |
| 19 | Philadelphia-Camden-Wilmington | USA | 946.58 |
| 20 | Atlanta-Sandy Springs-Alpharetta | USA | 941.82 |
| 21 | Shenzhen | China | 922.69 |
| 22 | Toronto | Canada | 917.49 |
| 23 | Miami-Fort Lauderdale-Pompano Beach | USA | 880.14 |
| 24 | San Jose-Sunnyvale-Santa Clara | USA | 872.41 |
| 25 | Taipei | Taiwan | 867.83 |
| 26 | Chongqing | China | 866.56 |
| 27 | Guangzhou | China | 863.35 |
| 28 | Sydney | Australia | 855.03 |
| 29 | Hong Kong | China | 838.85 |
| 30 | Nagoya | Japan | 834.30 |
| 31 | Melbourne | Australia | 772.67 |
| 32 | Phoenix-Mesa-Chandler | USA | 769.09 |
| 33 | Jakarta | Indonesia | 760.25 |
| 34 | Suzhou | China | 751.51 |
| 35 | Minneapolis-St. Paul-Bloomington | USA | 745.95 |
| 36 | Detroit-Warren-Dearborn | USA | 731.66 |
| 37 | Mumbai | India | 723.98 |
| 38 | Wuhan | China | 718.68 |
| 39 | National Capital Region | India | 715.60 |
| 40 | San Diego-Chula Vista-Carlsbad | USA | 708.97 |
| 41 | São Paulo | Brazil | 701.64 |
| 42 | Chengdu | China | 699.39 |
| 43 | Nanjing | China | 690.57 |
| 44 | Denver-Aurora-Lakewood | USA | 689.39 |
| 45 | Busan-Gyeongnam | South Korea | 687.14 |
| 46 | Bangkok | Thailand | 685.12 |
| 47 | Mexico City | Mexico | 682.45 |
| 48 | Madrid Metropolitan Area | Spain | 680.57 |
| 49 | Hangzhou | China | 678.72 |
| 50 | Istanbul | Turkey | 677.02 |
This table, based on 2025 estimates, shows US metros like Dallas and Houston leveraging energy and logistics, while Chinese cities like Shenzhen explode via tech manufacturing.
US Dominance: Why America Leads the Pack
With entries from Chicago to Denver, the US’s edge lies in innovation ecosystems—Silicon Valley’s venture capital culture, for instance, turns ideas into billions. From my talks with founders, it’s the risk-tolerant mindset that propels growth. Tip for aspiring movers: Target mid-tier like Atlanta for affordability; avoid overlooking visa hurdles.
Asia’s Rise: From Shanghai to Jakarta
Asia’s 18 spots underscore shifts—Shanghai’s ports handle global trade, Jakarta’s population drives consumer booms. Patterns show urbanization fueling GDP, but with traffic woes. Seasonal advice: Visit during dry seasons for business ease.
Europe holds steady with London and Paris, leveraging history in finance and culture.
Factors Fueling Urban Riches: Innovation, Infrastructure, and More
High GDP stems from key drivers: Tech hubs like San Francisco attract talent with high salaries, finance centers like New York thrive on markets. I’ve seen how infrastructure—think Seoul’s subways—boosts efficiency.
Step-by-step for cities aiming up: 1) Invest in education for skilled workers. 2) Foster startups via incentives. 3) Build sustainable transport. Common mistake: Ignoring green policies—pollution can deter investors; counter with eco-initiatives.
Advanced: Watch geopolitics; tariffs hit export-heavy spots like Guangzhou.
Challenges and Pitfalls: The Dark Side of Wealth
Not all glitters—high costs in Singapore squeeze middle classes. From observations, inequality breeds unrest; solutions include inclusive growth programs.
Future Trends: What’s Next for the Top 50 Richest Cities by GDP?
Projections hint at India’s Mumbai climbing via digital leaps, while AI could supercharge San Jose. In my view, sustainability will define winners—cities adapting to climate win long-term.
Navigating the Top 50 Richest Cities by GDP for Real Insights
After years dissecting economic landscapes, these top 50 richest cities by GDP illuminate not just numbers, but human stories of resilience and reinvention. From Tokyo’s precision to emerging dynamos like Chengdu, they offer blueprints for prosperity. Trust this lens—it’s drawn from patterns that endure, guiding you toward informed choices in a wealth-shifting world.
FAQs
What are the top 50 richest cities by GDP? The list tops with Tokyo at $2.55T, followed by New York at $2.49T, and includes diverse metros like Shanghai and London.
Which city has the highest GDP in 2025? Tokyo, Japan, leads with $2.55 trillion, driven by its tech and manufacturing sectors.
What is the richest city in the USA by GDP? New York-Newark ranks highest at $2.49 trillion, with Los Angeles and Chicago following.
How is city GDP calculated? It measures total goods and services produced in metropolitan areas, using nominal values for comparisons.
Why do US cities dominate the richest list? Diversified economies in tech, finance, and energy, plus large populations, boost their outputs.
What factors make a city rich by GDP? Innovation, infrastructure, talent attraction, and strategic industries like finance and manufacturing.
External Sources:
https://ceoworld.biz/2025/11/07/the-worlds-richest-cities
https://en.wikipedia.org/wiki/List_of_cities_by_GDP
https://www.visualcapitalist.com/top-50-economies-by-gdp-in-2025
https://www.brookings.edu/articles/metropolitan-gdp
https://www.oecd.org/regional/regional-policy/regionaldevelopmentindicators.htm
https://data.worldbank.org/indicator/NY.GDP.MKTP.CD
#RichestCities #CityGDP #GlobalEconomy #UrbanWealth #EconomicRankings
🏙️ 2025 City GDP Rankings Quiz
Test Your Knowledge of the World’s Economic Powerhouses!