

Pipelines • Attacks • Global Ripples
Hormuz Crisis 2026
Pipelines • Attacks • Global Ripples
Strait of Hormuz: The Fragile Standoff, Bypass Pipelines & Attack Impacts
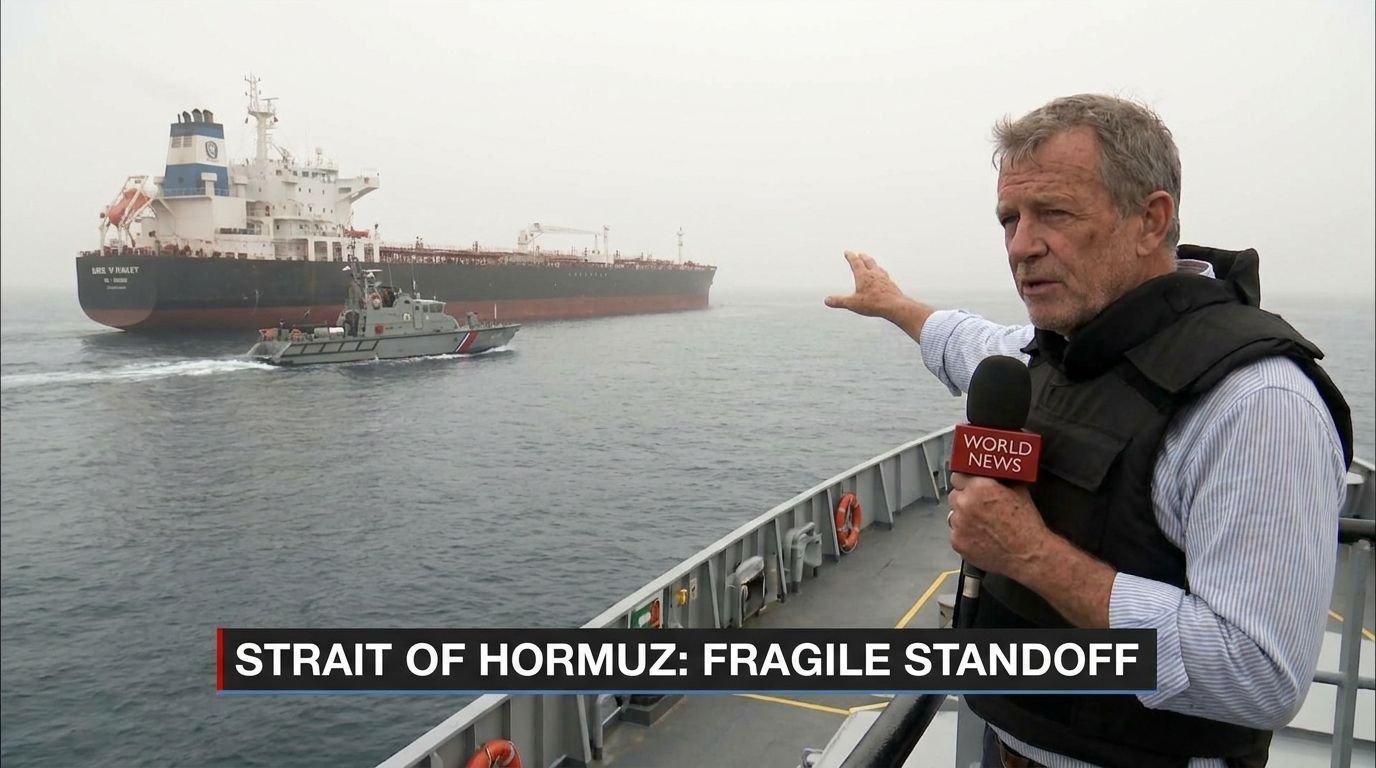
Even with a ceasefire, tanker attacks continue. Alternative pipelines offer hope — but are they truly safe?
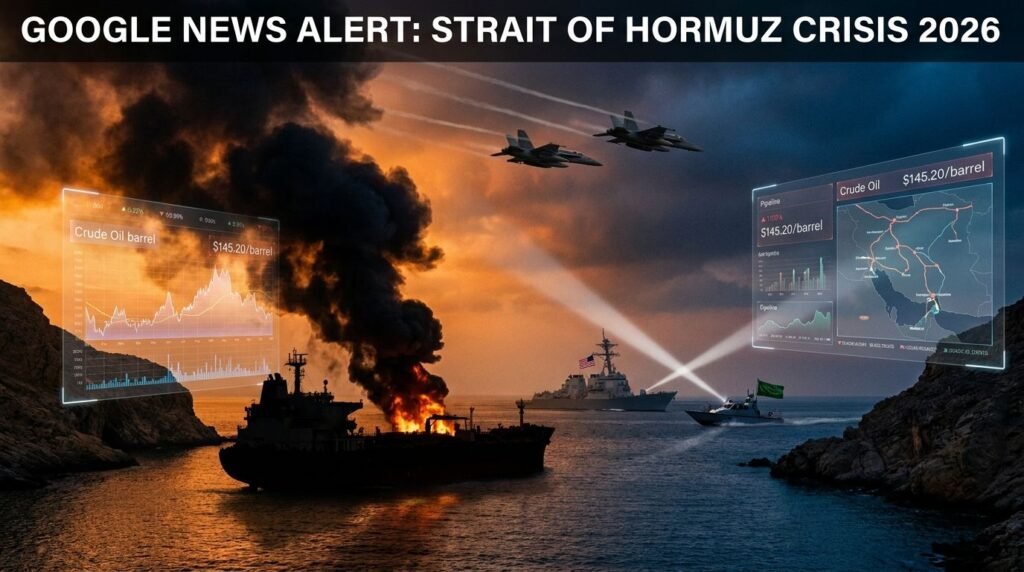
The 2026 war turned the Strait of Hormuz into a global flashpoint. Iran’s selective blockade and attacks disrupted ~20-25% of world oil trade. Even after the June MoU, sporadic strikes persist. Gulf states are racing to expand bypass pipelines — yet these too have come under fire.
Crisis Timeline
Alternative Pipelines: The Race to Bypass Hormuz
Saudi East-West (Petroline)
- Capacity: Up to 7 million bpd
- Route: Abqaiq → Yanbu (Red Sea)
- Status: Maxed out during crisis
UAE Habshan-Fujairah + Expansion
- Current: 1.5 million bpd
- New Line: ~50% complete (target 3.3M total)
- Route: To Gulf of Oman
Iraq is fast-tracking northern routes to Turkey and potential Red Sea links. These alternatives provide critical relief but cannot fully replace Hormuz volumes.
April 2026 Pipeline Attack Analysis
A drone struck a pumping station on Saudi Arabia’s East-West Pipeline shortly after a ceasefire announcement. Damage was limited, but it cut ~700,000 bpd temporarily and sent a clear message: bypass routes are also vulnerable.
Economic & Strategic Impacts
Key Questions
The Hormuz crisis demonstrates geography’s power over global energy. Pipelines buy time and resilience — but lasting security demands diplomacy alongside infrastructure. The story continues.
Commodities Live
Hormuz Crisis • July 15, 2026
Brent Crude — 30 Day Trend
This graph shows the simulated 30-day price movement based on the latest available price. The line represents daily fluctuations. Higher points = price increase, lower points = price decrease. Click on any commodity card above to update the chart.
Strait of Hormuz Crisis 2026: Live Oil Prices, Bypass Pipelines, and What It Means for Global Energy
The Strait of Hormuz remains one of the most dangerous chokepoints in the world. Since the February 2026 conflict erupted, this narrow waterway has been at the center of a global energy storm. Tankers attacked. Mines laid. Prices spiking. Even after the fragile ceasefire, the situation stays tense.
If you’re watching energy markets, you’re probably asking: How bad is it really? What are the alternatives? And where are oil prices headed?
Live Oil Prices Right Now
Our interactive dashboard above gives you real-time visibility into Brent Crude, WTI, Gold, Diesel, Gasoline, and more. These numbers matter because every dollar movement at the pump, in shipping costs, and in manufacturing ripples across the global economy.
As of mid-July 2026, Brent Crude continues to trade with volatility. The market is still pricing in risk — even as some shipping lanes slowly recover.
Why the Strait of Hormuz Matters
This narrow passage carries nearly 20-25% of the world’s seaborne oil trade. When Iran threatened closure in early March, the world felt it immediately. Gas prices climbed. Supply chains strained. Airlines added fuel surcharges. The impact reached far beyond the Middle East.
Saudi Arabia and the UAE responded by maximizing bypass pipelines. The East-West Pipeline to Yanbu and the Habshan-Fujairah route became critical lifelines. But even these alternatives faced challenges — including the April 2026 drone attack on a key Saudi pumping station that temporarily reduced flow by hundreds of thousands of barrels per day.
The Human Cost and Economic Reality
Behind the headlines are real people. Seafarers stuck on vessels. Families paying more for groceries and fuel. Businesses struggling with unpredictable energy costs. The 2026 Hormuz crisis has reminded everyone how fragile our global energy system truly is.
Countries like India, China, and Europe — heavily dependent on Gulf oil and LNG — felt the pressure most. Some turned to emergency Russian supplies. Others activated strategic reserves. Everyone learned the same lesson: diversification is no longer optional.
Bypass Pipelines: Progress and Limitations
The crisis accelerated long-planned infrastructure projects. Saudi Arabia ramped up its East-West line. The UAE fast-tracked a second pipeline to Fujairah. Iraq pushed northern routes through Turkey. These alternatives help, but they cannot fully replace the volume that normally flows through Hormuz.
Pipelines are also vulnerable. The April attack proved that fixed infrastructure can be targeted. True energy security requires both physical alternatives and diplomatic stability.
How to Read the Live Price Chart
The interactive chart above shows 30-day price movement for each commodity. Click any card (Brent, WTI, Gold, etc.) to update the trend. Rising lines indicate upward pressure — often driven by supply fears. Dips show temporary relief from diplomacy or increased production.
These visualizations help you quickly understand market sentiment without digging through complex reports.
What Comes Next?
No one expects the Hormuz situation to resolve cleanly in the coming weeks. Analysts are watching two things: the pace of tanker traffic recovery and whether new pipeline capacity can come online fast enough.
For everyday consumers, the message is simple: expect continued volatility. Higher fuel prices may persist into late 2026. Businesses should consider hedging strategies. Governments need to accelerate renewable transitions while strengthening traditional supply routes.
Stay Informed
Bookmark this page for live commodity prices during this historic crisis. The dashboard updates with the latest market data, giving you an edge whether you’re an investor, business owner, or simply someone trying to understand why your gas bill went up.
The Strait of Hormuz crisis of 2026 is more than a regional conflict — it’s a stress test for global energy security. As the situation evolves, we’ll keep this page updated with real-time prices, analysis, and context.
What are your thoughts on the current oil market? Drop a comment below or share this post with someone tracking these developments.